Species list
In this section we discuss how many species and which species should be evaluated to assess the genetic diversity indicator for a country.
Table of contents
- On the definition of subspecies, and issues of taxonomy
- Creating species lists
- How to choose a diversity of species
- Minimum number of species to assess
- Keep the same species list while collecting data over time
On the definition of subspecies, and issues of taxonomy
Generally, we are assessing indicators at the species level. However, taxonomic uncertainty, disagreement, and revision can be common in some groups (i.e., lumping and splitting of species). In these cases, species may be better assessed at finer (subspecific) scales to more easily accommodate change over time (e.g. if a subspecies is latter recognized as a species). Additionally, assessors may choose to assess entities at the subspecific level if the subspecies is an important unit for that country (e.g., it has separate reports, protection, or Red List status).
Hybridization
Hybridization and introgression are important evolutionary forces across the tree of life (Mallet 2005). In a conservation context, these processes can be considered “natural” and potentially adaptive (Hamilton and Miller 2016), or maladaptive and a conservation threat. Therefore, what constitutes a hybrid will vary from species to species. We provide two recommendations for how to account for hybrids when calculating the genetic indicators, depending on the available data.
-
If there’s no available data on the conservation value of hybrids to the focal species, then for the purpose of making the indicators as clear and operationally feasible as possible, hybrid individuals should not be included in indicator calculations. If hybrid individuals are known, then Nc estimates should be adjusted to subtract out hybrid individuals, prior to conversion for calculating the Ne 500 indicator. If a population is known to be composed primarily or entirely of hybrid individuals, then that population should be considered extinct for the purpose of calculating the PM indicator.
-
However, in scenarios where relevant managers or taxonomic experts for a given species have acknowledged that hybrids, or individuals with a certain proportion of hybrid ancestry, are inevitable and/or valuable for conservation purposes, then it would be appropriate to include those hybrid individuals in indicator calculations (for the Ne500 or PM indicator).
Creating species lists
The species list could be selected specifically for monitoring genetic diversity, or be a subset of other lists that countries already use for monitoring or conservation priority-setting. Hvilsom et al., (2022) provide feedback on identifying the most appropriate set of species or populations for monitoring genetic diversity.
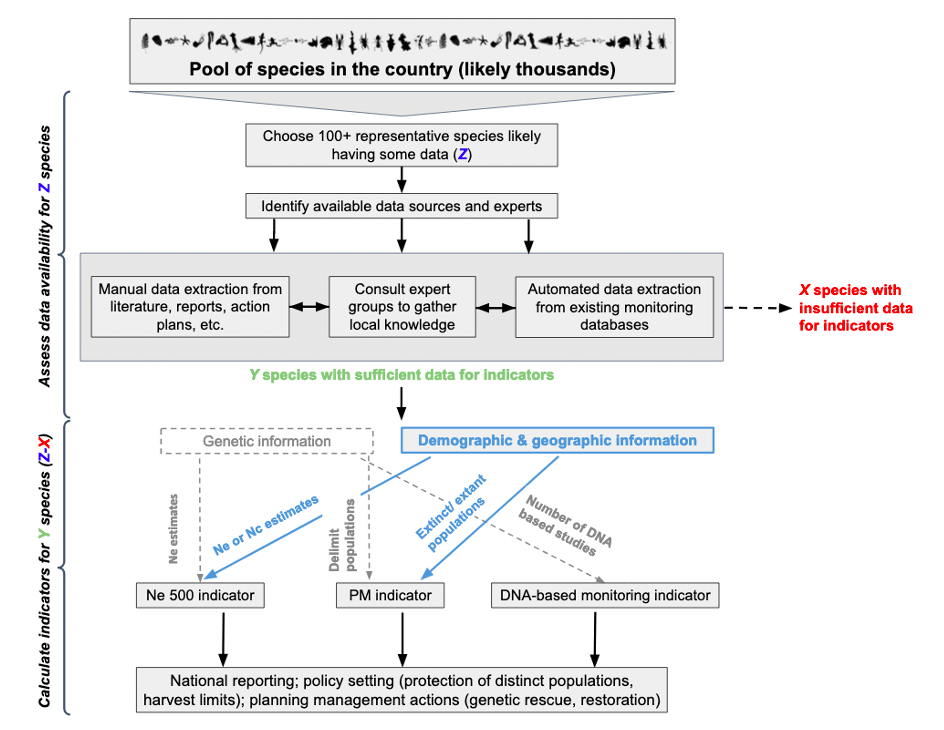
Each country team should begin by making a list of at least 100 candidate species for which there is likely some data for the indicators. ‘Likely to have some data’ means that the species are not recently discovered, poorly known, part of a group with highly uncertain taxonomy, etc. This candidate list becomes the list of species to try to collect data for. Some proportion of these species will not have sufficient data; this is normal and expected- in a trial of indicators in nine countries, around 17% of species did not have sufficient data for at least one indicator. It is typical to focus on species and populations endemic to the country of interest; see the Data Sources section for more details.
It is vital to document how the list is developed in order to identify any biases (e.g. mostly common species). It is not necessary for all chosen species to have high quality data across their range. While indicator values will be more accurate if all species have data for all populations, complete population data may only be available rarely. It is OK if data are available for only one of the two indicators, or for only some populations of a species (as explained under Common Issues below). Moreover, upon investigation, species initially deemed likely to have some data may actually have insufficient data to calculate either indicator. After the initial list is made, species should typically not be removed from it: the indicators can be calculated with and without various types of data and at different levels of missing data.
There are some species where it will be particularly hard or impossible to quantify the Ne 500 and Populations Maintained indicators, and they should be excluded from the species list. For example, evaluation of the Ne 500 indicator will be difficult for species where natural subpopulations are typically very large and/or hard to measure, such as microcrustaceans, many insects, some fungi, and some plants with deep soil seed banks (where all ‘individuals’ cannot be counted). Populations of such species can grow massively in a short amount of time and have high standing genetic variation (Chaturvedi et al. 2021). We advise not attempting to include such species in a country’s first indicator evaluation, due to difficulty in finding and interpreting data.
How to choose a diversity of species
Candidate lists should be representative (e.g., able to provide a typical picture of what other species are experiencing for the indicators). This may include species of commercial interest, but should not be limited to commercially important species. If possible, the species should represent a diversity of at least some of:
-
Ecosystems / biomes within the country (e.g. temperate forests, rainforest, etc)
-
Taxonomic groups (e.g. mammals, invertebrates, herpetofauna, plants, birds, fish)
-
Terrestrial and aquatic realms
-
Range size and commonness (wide-randing, restricted, etc)
-
Threatened status (threatened or not)
If possible, also include a range of:
*Value (economic, ecological, social)
*Traits (body size, lifespan/ generation time, dispersal)
Selected wild species should generally be native (e.g. non-introduced, non-invasive). However the indicators can also be applied to some proportion of non-native crops, domesticated animals, and crop wild relatives, depending on country goals and priorities.
The ability to fully include all of these groups will vary by country, due to native levels of biodiversity and capacity/ data availability. Further discussion of categories of species can be found in Hollingsworth et al 2020, page 17-19. Full taxonomic and ecological diversity will be difficult (and often impossible) for the first-time assessment of the indicators. As mentioned above, some bias in species selection is expected and is acceptable as long as species selection is well documented. Given clear documentation of the selection approach, concerns about bias should not prevent initial assessments of the indicators since the first effort helps a country set up the infrastructure and methods of data gathering and analysis.
Minimum number of species to assess
We recommend evaluating a minimum of 100 species in order to ensure a sufficiently representative and diverse sample (e.g., across taxonomic groups, ecosystem types, threat status, commonness, etc.) is taken within each country.
Keep the same species list while collecting data over time
It is important to fill in the KOBO form for every species on the species list, even if there is little data available, and even if the indicator cannot be calculated. In other words, we expect some proportion of the species list to have no useful data at the time of assessment (see Fig 2). Knowing how much data is missing will provide valuable insight into the challenges countries face in assessing species and where data are lacking. Additionally, this information may encourage additional data collection over time to fill in gaps in biodiversity knowledge. However, if missing data is extensive (say, >50% of the species list), country teams may revisit their original species list and continue to add more species.