Ne 500 indicator
Effective population size (Ne) is a well-accepted metric for measuring the rate of loss of genetic diversity within populations. The effective population size is the genetic complement of the population’s census size; where census size influences ecological aspects of a population, genetic factors of a population are influenced by Ne. The Ne controls the rates of both random (genetic drift) allele frequency change and allele loss, as well as and random increases in inbreeding. When Ne is below 500, genetic diversity loss accelerates through genetic drift and increases in inbreeding (mating among related individuals).
Why does this matter? Let’s consider an example of overharvesting fish populations, which has reduced population sizes and contributed to the loss of unique alleles and genes over time. Coupled with climate change, this has severely impacted the ability of overharvested species’ to adapt and recover. In the case of North Atlantic cod (Gadus morhua), a supergene associated with migratory behavior has been lost from several populations (Matschiner et al., 2022). This could change the species’ distribution, altering marine ecosystems, and eventually lead to the extinction of the species.
As explained below (see figure), an Ne above 500 (which typically corresponds to a census population size of 5,000) will maintain genetic diversity within populations for a long time. In other words, Ne 500 is a “sufficient” size to prevent loss of genetic diversity within populations. See What is a population for a background on how to define a population in the context of the genetic diversity indicators.
Ne below 500 is the approximate point when populations are less able to adapt via natural selection, and start to experience genetic loss. We note that Ne below 50 will lead to very rapid increases in inbreeding, losses of fitness, and changes in the genetic composition of populations, causing high risk of extinction in the short-term. The Ne 500 and Ne 50 thresholds are useful to conservation management and recovery programs (Mace et al 2008). Because of the need to maintain genetic diversity and adaptive capacity for the long term, the Ne 500 indicator is a key genetic indicator.
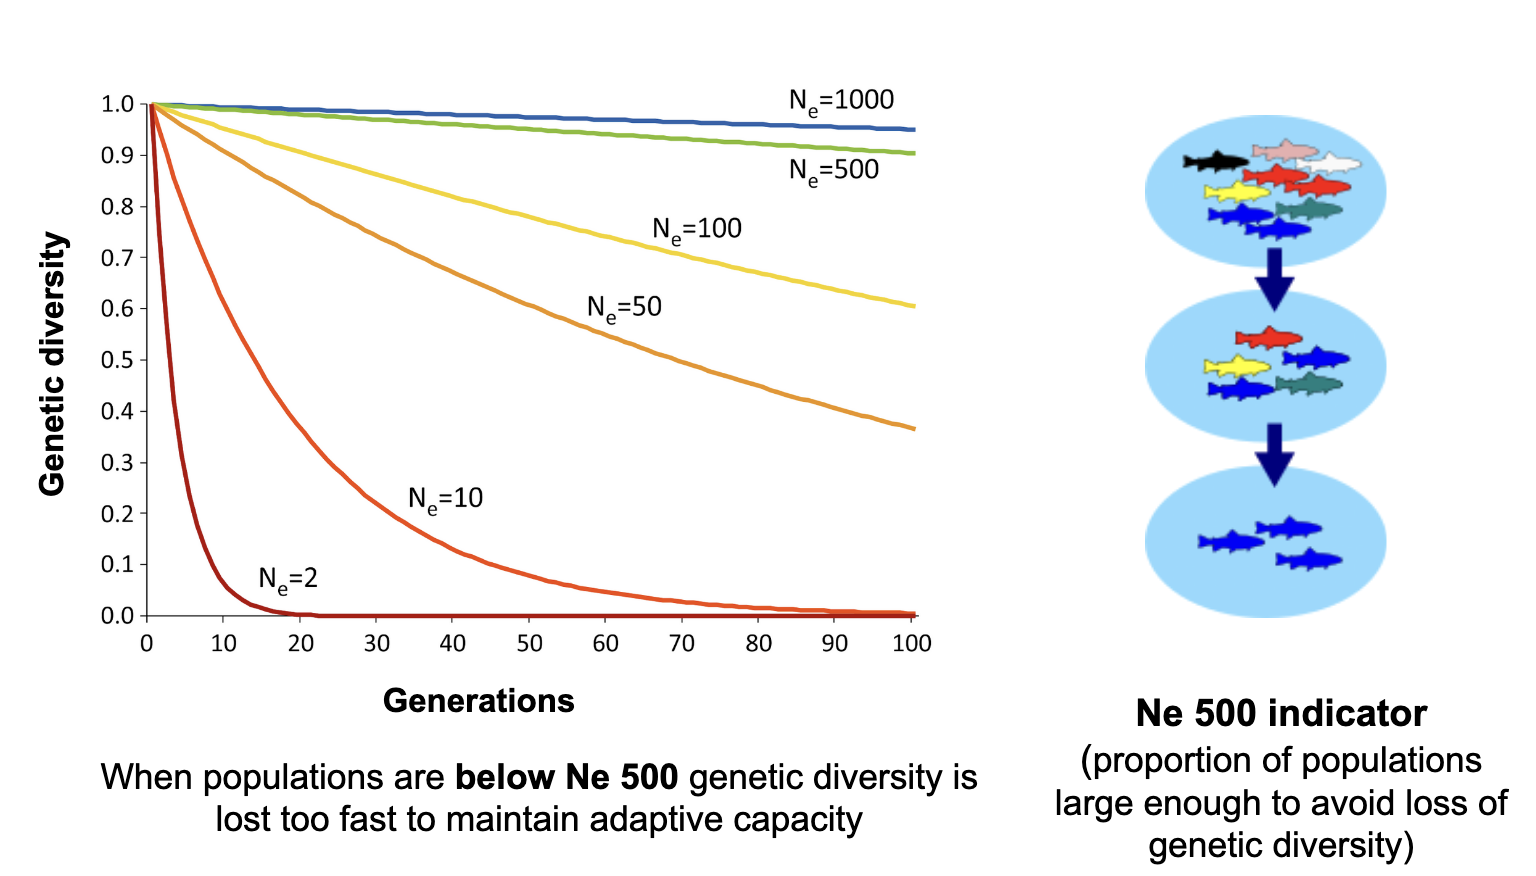
The relationship between effective population size and genetic diversity. Left: The effective population size (Ne) is represented with the lines on the plot, with time (generations) on the x axis and genetic diversity on y axis (adapted from Willi et al. 2021). Small populations lose genetic diversity over time more rapidly than large populations, often leading to inbreeding depression and ultimately the complete collapse of the population (extinction). Populations above Ne 500 are capable of maintaining genetic diversity into the long-term. Right: The Ne 500 measures the proportion of populations large enough to avoid the loss of genetic diversity.
The Ne 500 indicator is derived by (a) comparing the effective population size (Ne) of each population to a critical threshold, 500, (b) counting the number of populations above the threshold (and therefore maintaining genetic diversity), and (c) dividing this number by the total number of existing populations since the reporting started (see section Measuring temporal change for why). For example: if a species has 5 populations, 3 of which are above Ne 500, then the indicator value for this species would be 3/5 = 0.6. For a detailed explanation on calculating the Ne 500 indicator across multiple species see Hoban et al. (2023b) and Hoban et al. 2024, and the Calculations section of these guidelines.
The values for the Ne 500 indicator range between 0 and 1, with 0 indicating all populations have Ne < 500 (no populations are large enough to maintain genetic diversity) and 1 indicating that all populations have Ne > 500 (all populations are large enough to maintain genetic diversity).
The Ne 500 indicator is likely the best evidence of genetic status and risk of genetic erosion when DNA sequencing is not available (the case for most species globally). This indicator is feasible and scalable for many species per country (see Hoban et al. 2024).
How to get the Ne? The Ne of a population can be estimated with statistical methods and DNA sequence data, when that is available. But for nearly all species, DNA data is not yet available. For many species, it is sufficient and appropriate to obtain the Ne by using a simple transformation of census size (Nc, or the number of mature individuals) and an Ne to Nc ratio. An Ne:Nc conversion ratio of 0.1 is generally a conservative and suitable ratio to calculate Ne (although typical ratios may range from 0.1 to about 0.3 in many vertebrates and plants - this is a generalization). By applying a 0.1 Ne:Nc ratio, Ne = 500 translates to a threshold of Nc = 5,000 mature individuals.
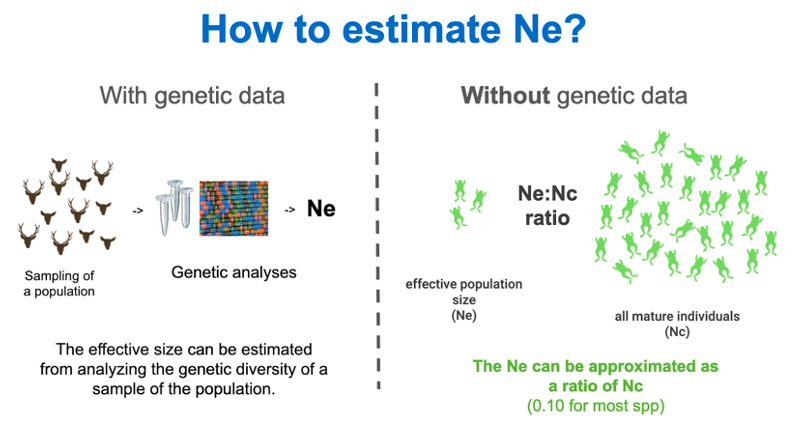
How to Estimate Ne. The effective population size (Ne) can be obtained by analyzing the genetic diversity of a sample of the population, using statistical methods and DNA sequence data. If genetic data is not available, Ne can be obtained from a simple transformation of the census size (Nc, the number of mature individuals) through an Ne:Nc ratio.
See section How to estimate Ne? for more details on how to obtain Ne data from genetic data or census sizes, and see the Equations section for more details on calculating the Ne 500 indicator.
Previous: Genetic diveristy and indicators Next: Populations maintained indicator